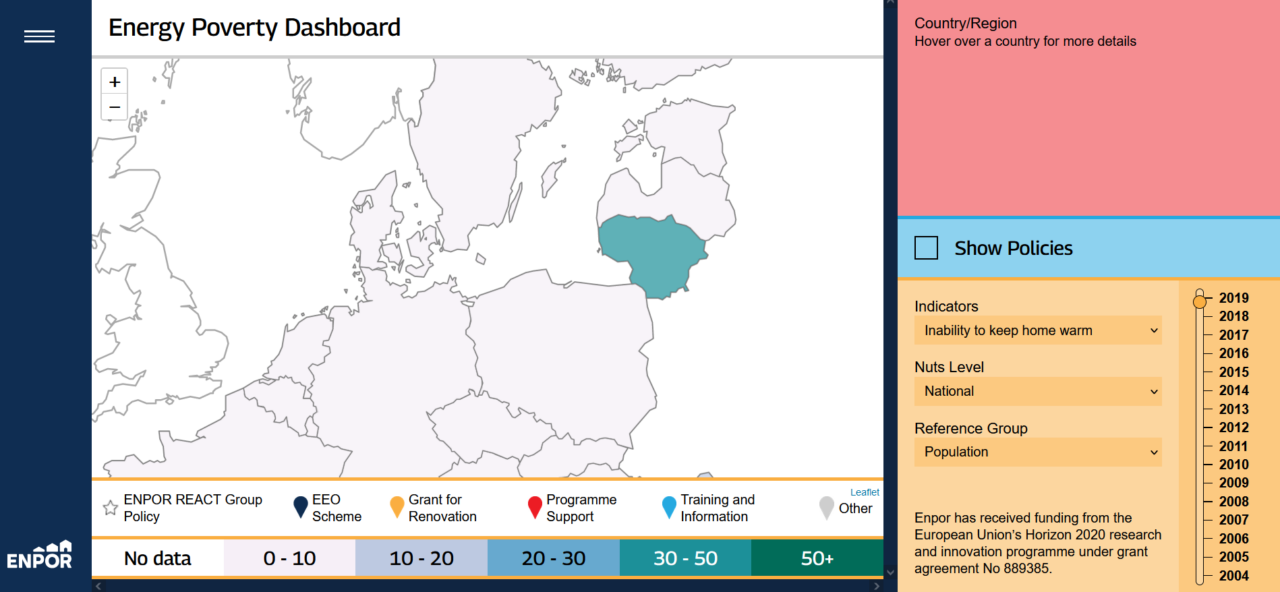
The EPD serves as a platform for stakeholders and policymakers to assess the success and failure of policies. It provides a platform for knowledge exchange within and between different national contexts as well as facilitates the dialogue between the REACT groups in national contexts. An information and action hub, decision-support and public engagement tool all at once, it provides customised new data in a user-friendly format while also offering affected stakeholders information on relevant initiatives, collaborations and forms of support.
The Energy Poverty Dashboard consists of 2 elements:
- Online maps to show the geography of energy poverty in the rented sector- and where available the PRS more specifically. The maps will help visualise data at the national, regional and (where possible) sub-regional scale using datasets from EU-SILC, EU EPOV, and Censuses and Household Budget Surveys;
- An interactive map of policies related to energy efficiency in the PRS, including ENPOR ones. The map will provide a visual record of relevant organisations operating at a variety of scales, with a range of geographical scopes. The interactive map will allow local agencies providing on the ground support to help connect vulnerable households to relevant policies and provide a participatory platform for all stakeholders, in particular the national REACT groups, to share experience of the policies and engage in local decision-making with regards to energy efficiency.
The Energy Poverty Dashboard is the first tool of its kind, spatially identifying energy poverty in the private rented sector across Europe, useful for NGOs, civil society and governing bodies to access information on energy poor populations, best practices and policies to tackle this issue, and to visualise whether projects are being undertaken in the areas of greatest need.
For the EPD purpose, a new indicator was developed: the Rented Private Housing Energy Poverty Indicator (REPI).
Below, the ENPOR Energy Poverty Dashboard Tutorial, a short tour to the tool.

